TOC Curve Generator
Zhen Liu
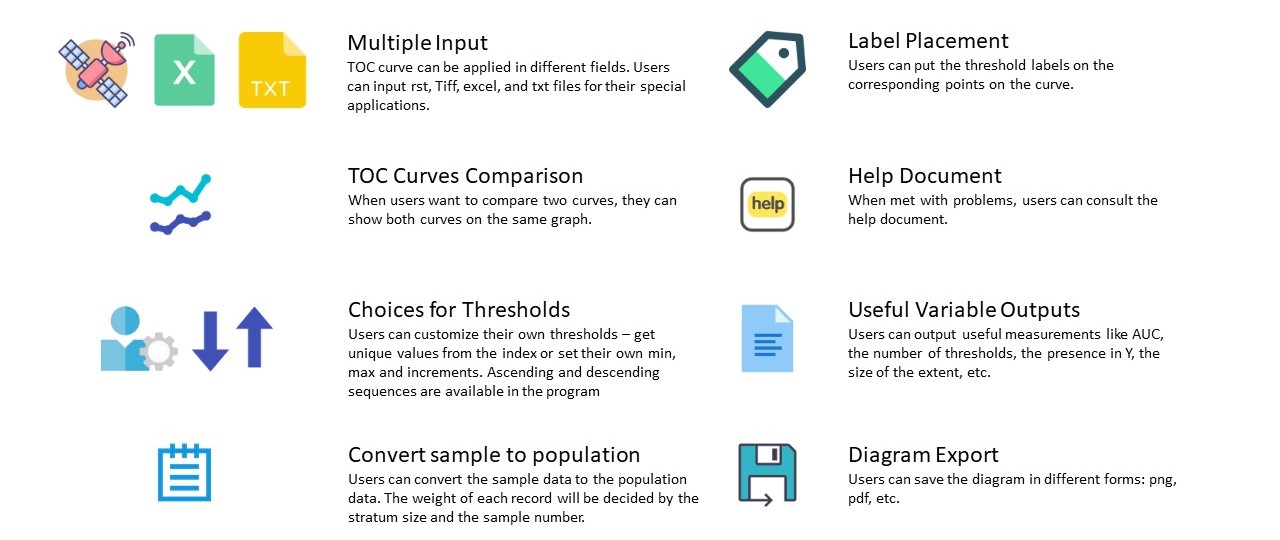
TOC Curve Generator is a computer program to make TOC curves. Users can generate TOC curves from various file formats and customize TOC curves for research.
How to Download and Run TOC Curve Generator
Click the right top button "Download" to download the program. Extact files to the local computer. Click "TOC_curve_generator.exe" to start the progam. The instruction slide is in the folder "instruction".
TOC python library -- PyTOC
PyTOC is released in November 2021! If you are a Python user, PyTOC can help you easily generate TOC curve for your applications in Python. Here is the link.
Papers describing the algorithms
Liu, Z.; Jr, R.G.P. The Total Operating Characteristic from Stratified Random Sampling with an Application to Flood Mapping. 2021, 18. Link
Pontius Jr, R.G.; Si, K. The Total Operating Characteristic to Measure Diagnostic Ability for Multiple Thresholds. International Journal of Geographical Information Science 2014, 28, 570–583, doi:10.1080/13658816.2013.862623. Link
Citation
If you make public a diagram that you worked out and/or checked with TOC Curve Generator, you may cite the software as follows:
Liu, Z., & Pontius Jr, R. G. (2021). The Total Operating Characteristic from Stratified Random Sampling with an Application to Flood Mapping. Remote Sensing, 13(19), 3922. https://doi.org/10.3390/rs13193922
Presentations
Zhen Liu presented the concepts and applications of the TOC from stratified random sampling in 2021 AAG-GISSG Student Honors Paper Competition and got the second prize.
Version Update
-
v.2.0.1
- Fix the problem of incorrect output for the "Maximum AUC" for the categorical variables
-
v.2.0.0
- Change the program framework and add new feature "Explanatory Ratio"in the export variable
-
v.1.2.7
- Solve the problem of "Maximum AUC" type in the "Categories" section. Now, it avoid pick the category in the mask area.
-
v.1.2.6
- fix the bugs in "Categories" block in the "Input" tab
-
v.1.2.5
- add "no marker" option in the display panel.
-
v.1.2.4
- The correct corner message on the axis is changed to be flexible.
-
v.1.2.3
- The marker will not be clipped around the coordinate axis.
-
v.1.2.2
- Users can select whether to show correct corner or uniform line in the display module.
- Eliminate the maximum and minimum boundary.
-
v.1.2.1
- Combine Three interfaces into one.
- The AUC can be calculated even though the number of pixels is large.
- The axis labels obey the rule.
- User can change the name of TOC curve and the unit name of each element.
- Speed up the startup.
- Remember the filefolder used last time.
- The cumstomized thresholds are determined by the start threshold.
- Avoid the shutdown when error occurs.
- The grey areas which represent non-interest are shown on the diagram.
Last modified November 9, 2021