Disaggregating Census Data in Somalia Using Random Forests
Zhen Liu
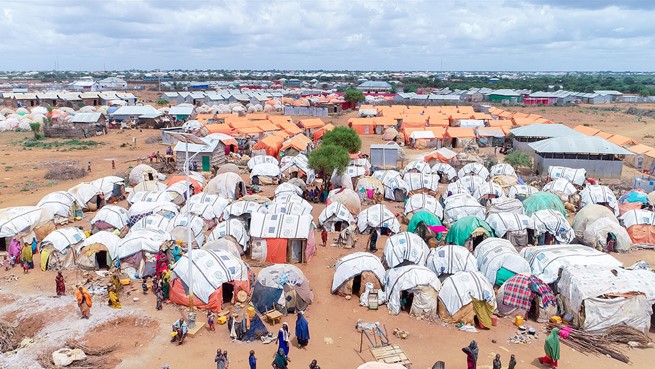
In 2014, the Population Estimation Survey (PESS) became the first extensive household sample survey to be carried out among the Somalia population in decades. In the meantime, millions of people in Somalia are suffering from the resource shortage, natural disasters, and disease.
For those countries like Somalia that do not have the reliable census data collection, the use of remotely sensed data is especially important for mapping population. This project is to generate the gridded population map in 2018 in Somalia by using Random Forest and an improved method. It will be critical in health, economic, and environmental fields across various temporal and spatial scales.
Remotely-Sensed and Ancillary Data

General Structure of the Project
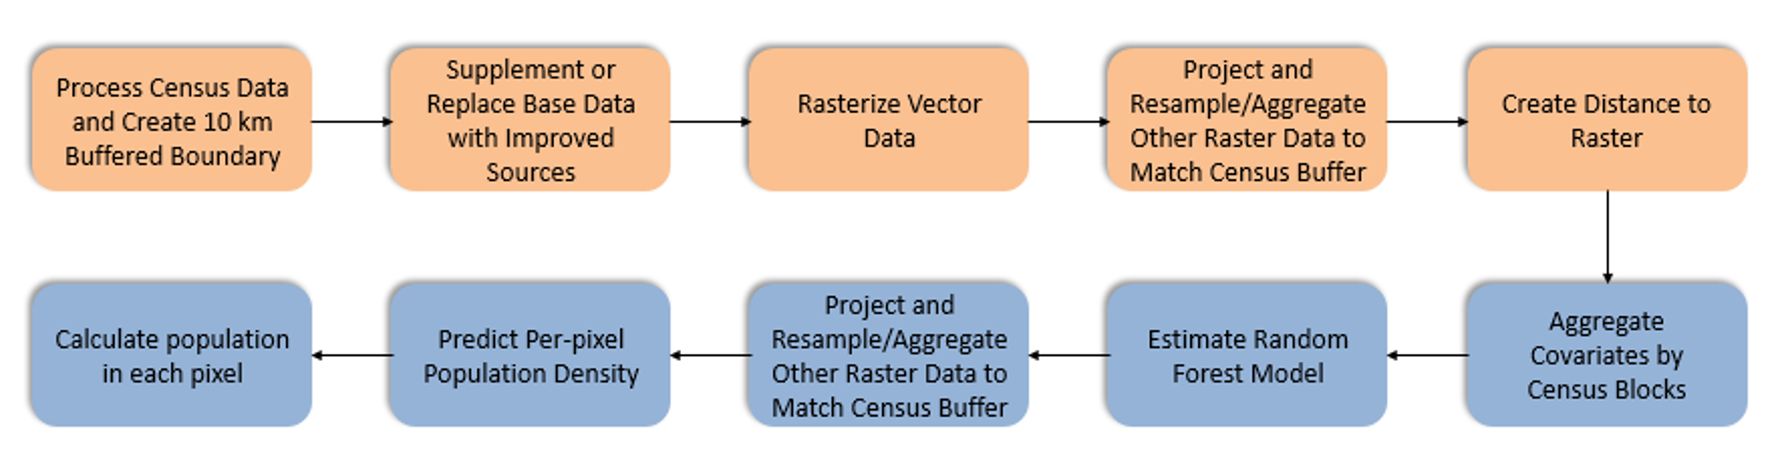
This figure represents the general structure of the data processing and map production procedure. The orange boxes represent data pre-preparation stages. Items in blue represent Random Forest model estimation, per-pixel prediction and redistribution of census counts. In the initial method, the log population density of each level 2 administrative unit is used as a dependent variable. In the improved one, the training unit will be changed.
Data Preparation
- In order to minimize edge effects associated with near-boarder populated areas, the census data are buffered 10 km.
- Also, we need to project all data into a conformal projection most appropriate for each country (e.g. UTM).
- The vector data is first projected and subset to match the buffered national borders, then is rasterized.
- Distance to the point data is generated as our covariates in the model.
- All raster covariates are resampled to match the rasterized census data and its buffer.
- We use a simple nearest neighbor filling approach to extend the edge of data sets and fill any gaps prior to model estimation.
Estimation by Random Forest
- In the initial method, the training units are level 2 administrative units.
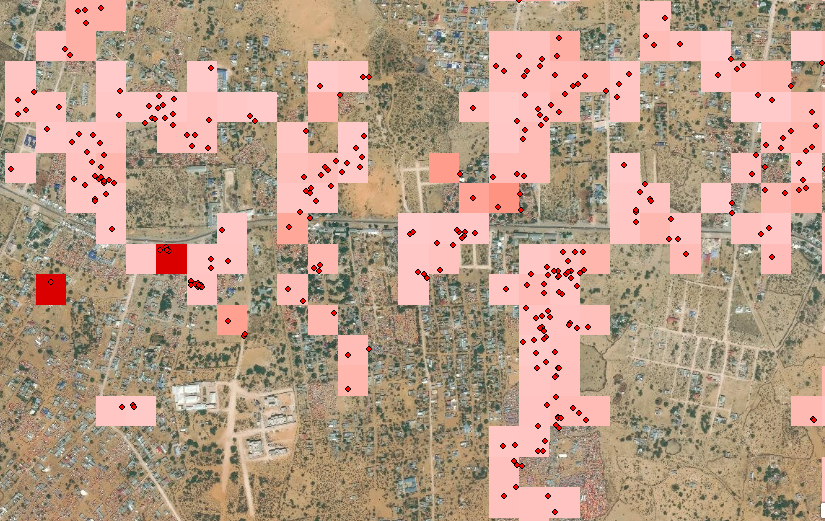
- In the improved method, we Integrate IDP sites in pixel and sum up the population. And, we use this pixels as pseudo administrative boundaries, the training unit will subtract the area and population of each pixel in the unit.
- Aggregate covariates by census blocks: we calculate zonal means for each continuous dataset.
- We log-transform the population density in order to create a more normal and even distribution of population density values with respect to other covariates.
- Due to the limited number of data, we use the out-of-bag score to assess the accuracy.
- The result of Random Forest is used to predict a country wide, pixel-level map of log population densities.
Result and Analysis
- Nightlight is the most important variable to explain the population density in the all features in two methods.
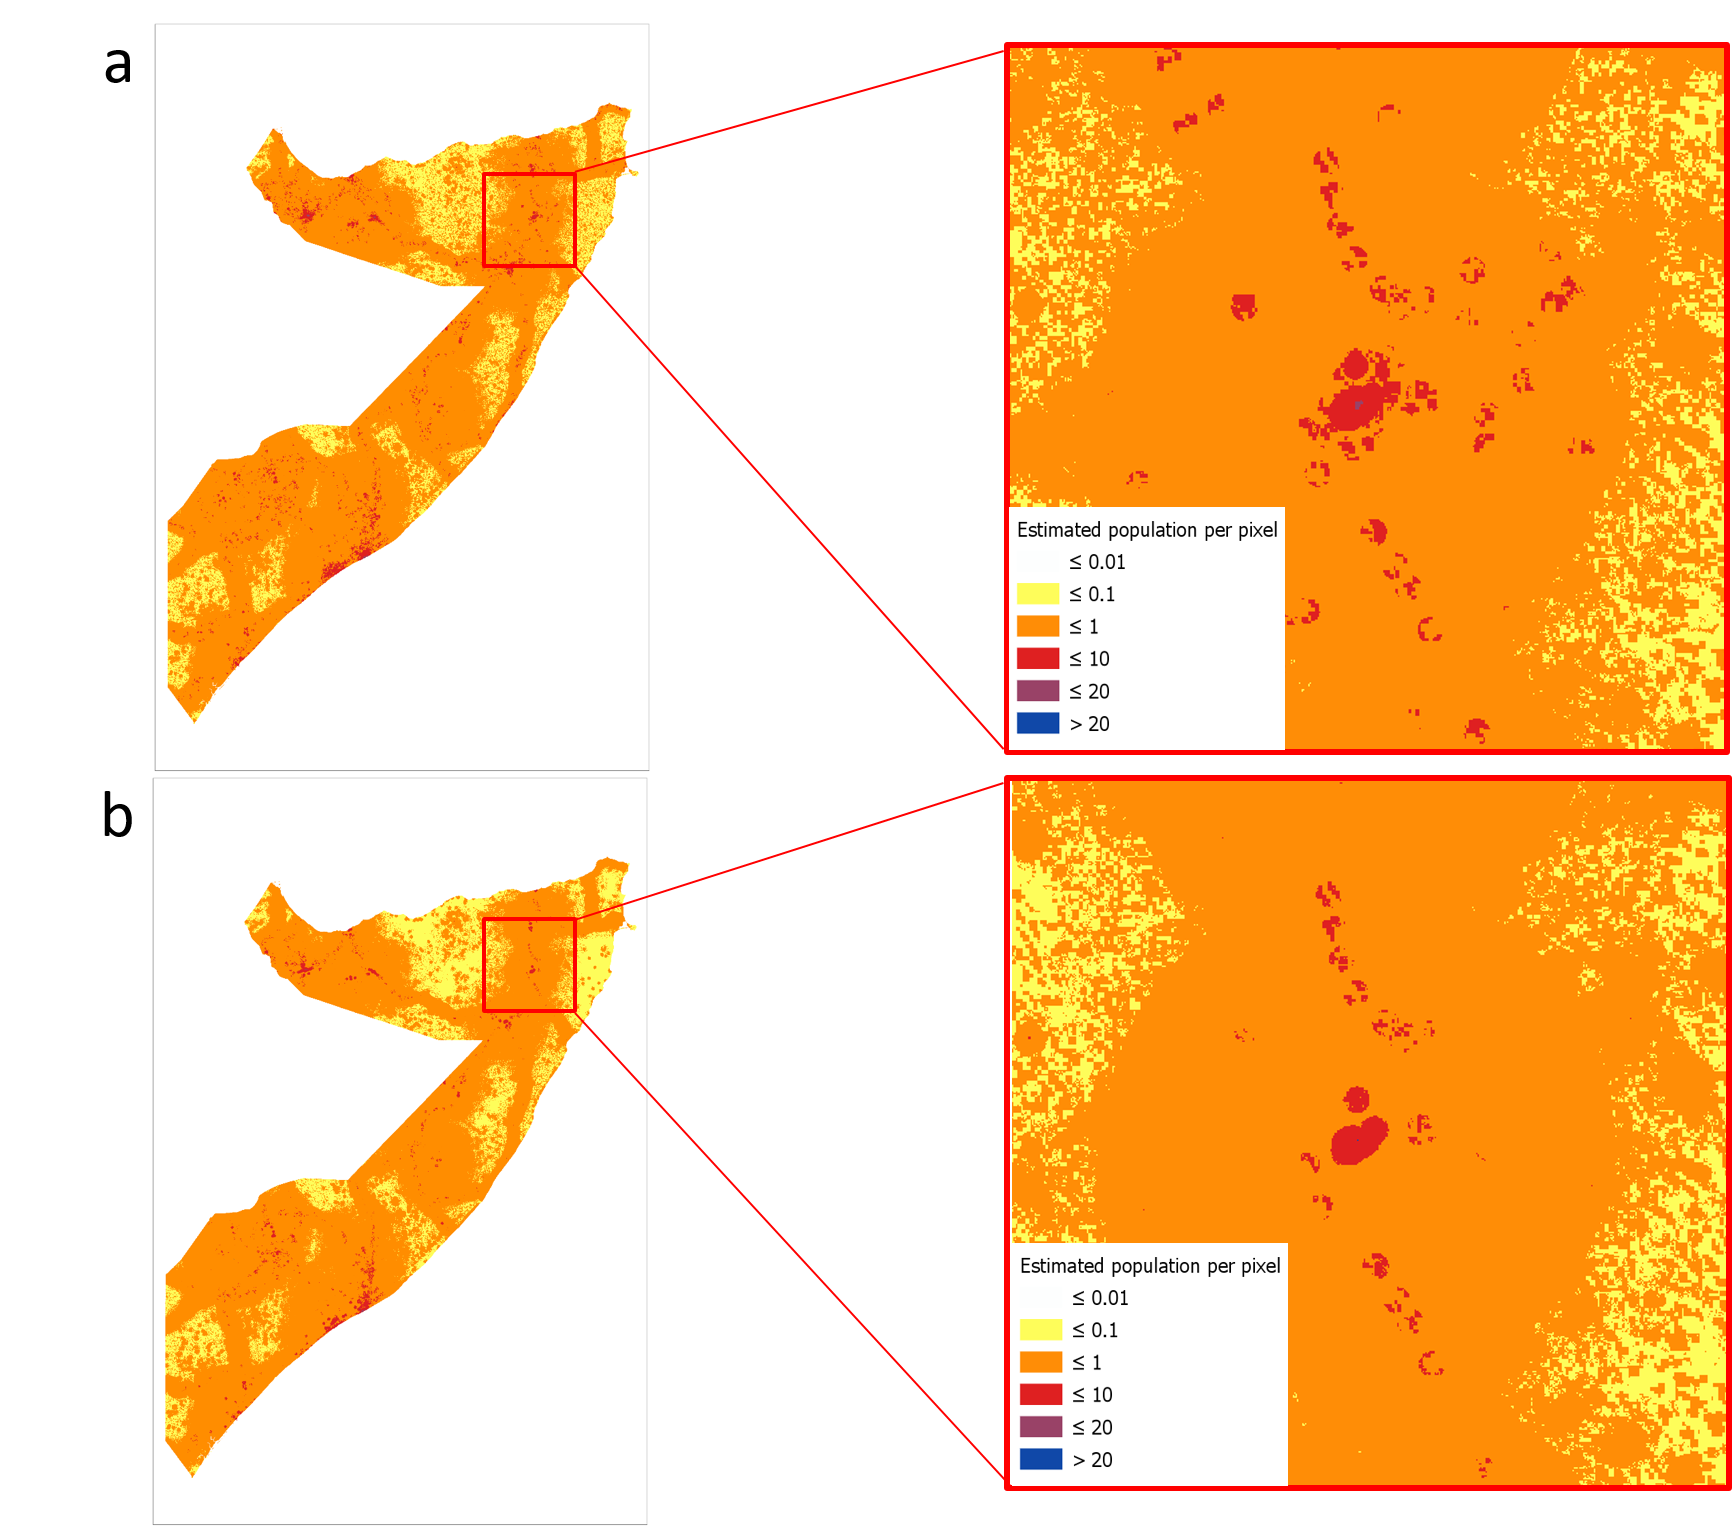
- Because a population of high density is in one or two pixels, other pixels in the same level 2 administrative unit don't have such high population density as the mean population density in the whole unit. So, Comparing two maps using initial method and the using improved method (with IDP data) in this project, the high density population is shown more obviously in 2018. This can avoid False alarm situations, which means that high population density in map, but not in reality.
- However, when we exclude the IDP data in the unit, the explanatory power of the variable Nightlight decreases, which means the IDP camps is highly related with the night light in Somalia, so that the OOB–score decreases too.
- Estimated census data in 2018 will affect the accuracy of the prediction.
Summary and Recommendation
Summary
- Random Forest performs well in disaggregating census data for population mapping.
- After subtracting the population of each IDP site from the training unit, the accuracy of the population density model will be enhanced.
- The improved method will decrease the explanatory powers of variables.
Recommendation
- If IDP data is accessible with no outline data, integrating IDP sites in the unit pixel is a good solution to improve the accuracy of prediction model.
Last modified September 22, 2020